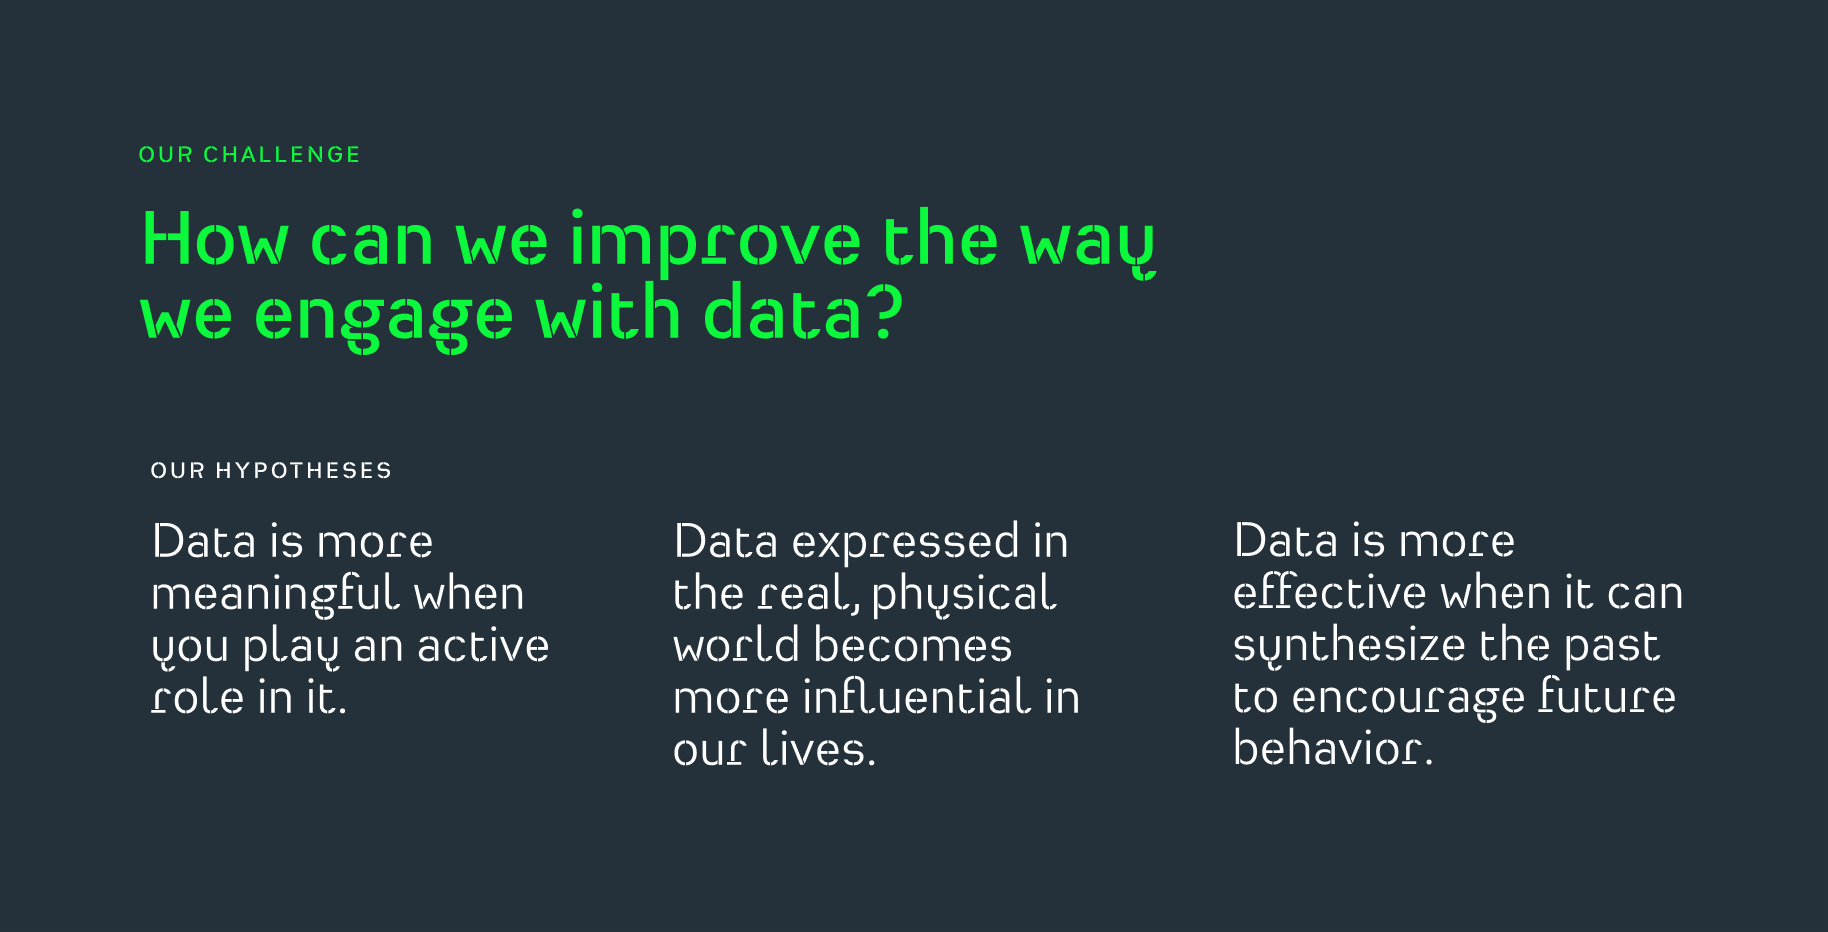
Surrounded by Data
With so much of our lives being measured, how do we connect to the meaning behind our data?
An exploratory project seeking to humanize and make use of the quantified self.
In the modern world, measuring and recording information about our daily lives has become commonplace and expected. We noticed a gap between the impulse to record everything and the ability to make real sense of it.
Studying this phenomenon, we developed a hypothesis: as creatures of the physical world, might we be able to connect more meaningfully with information through abstract physical objects – ones that represent the essence of the meaning rather than providing the hard numbers? Might rich, natural forms garner more emotional connections with their users? Surrounded by Data is an exhibition of five experimental artifacts that explores potential answers.
Client
Method (Internal)
Method (Internal)
Date
2016
Role
Role
Senior Designer
Design & Construction of Artifacts
Type
Software/Hardware R&D
IOT Research
Exhibition Design
Featured at
San Francisco Design Week
Objective
Can we articulate meaningful insight without discrete information?
We designed each artifact to explore how different gestural form factors can tell stories behind the information. Each artifact suggested a different type of data category: Time-based, location-based, financial, athletic, or social data, and represented them through basic spatial methods like movement, distance, illumination, and even organic growth. Instead of prescribing use cases to each artifact, we asked participants in the exhibition to tell us how they would use these objects. What stories did they believe these might tell? We were curious about what we might find if we started with emotion rather than function.
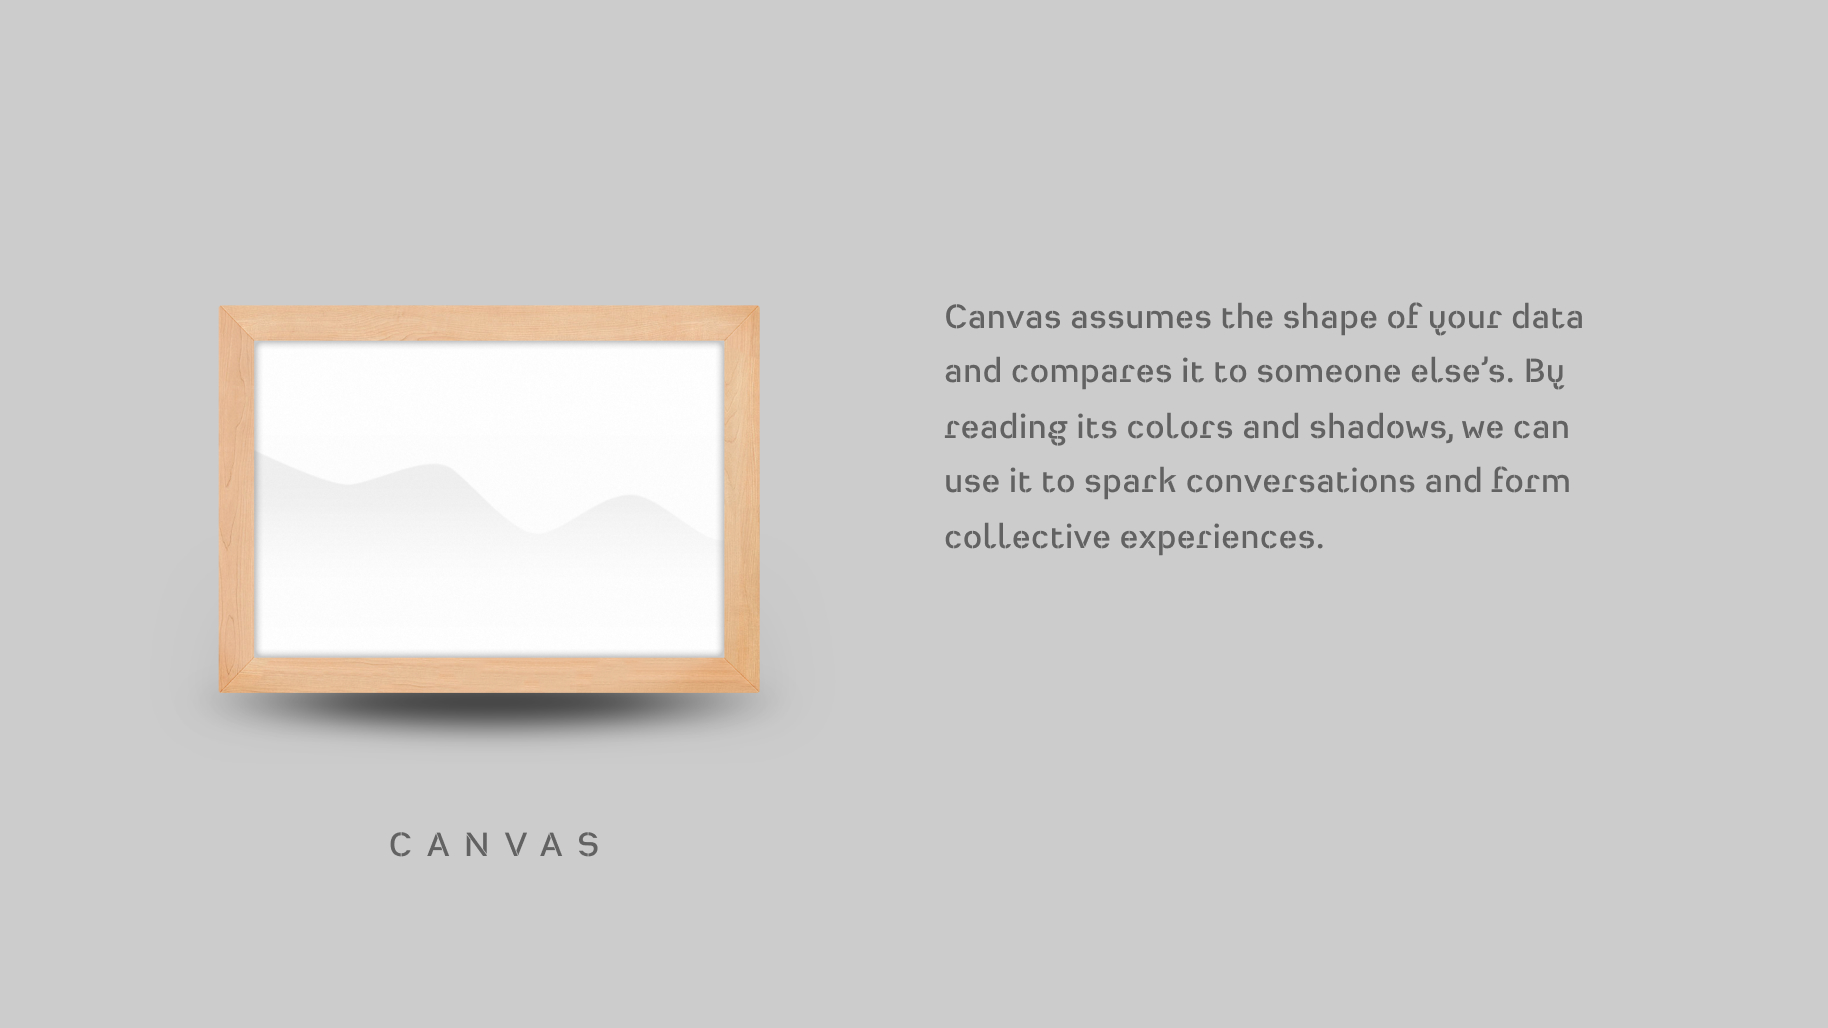
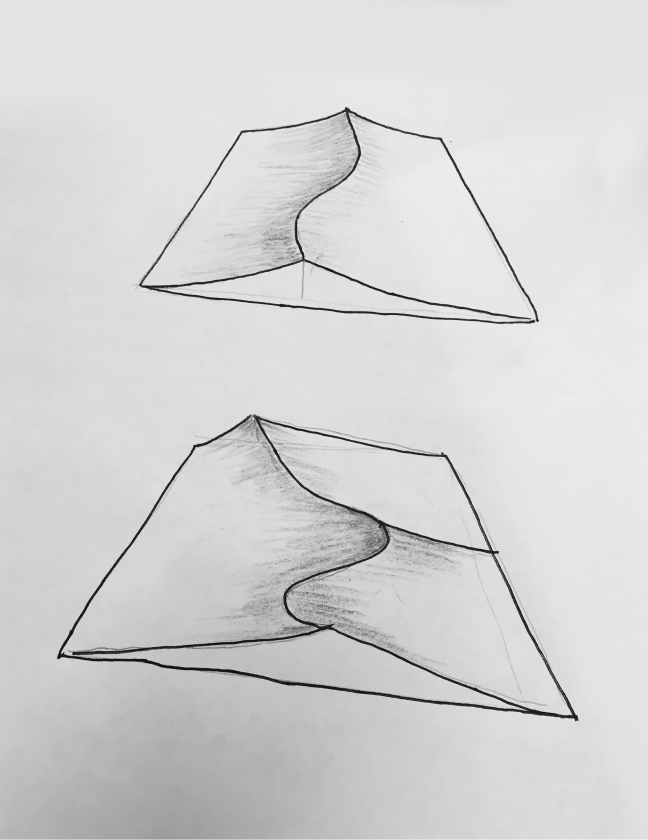
Artifact 1 – Canvas
Visualize by physical comparison
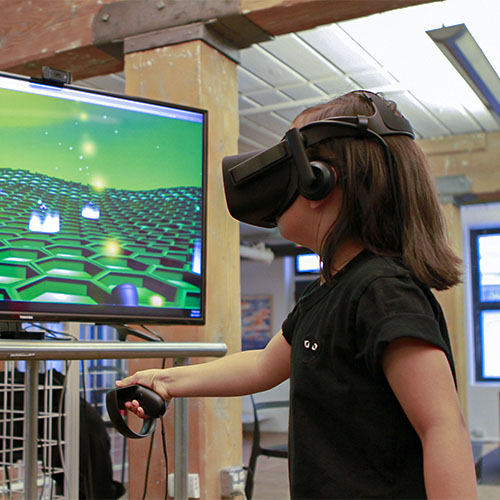
We were enamored with idea of expressing an insight through the subtlety of one simple moving spline. For the exhibition, we built out an experience for one potential use case. We invited participants to download an app that drew from their iPhone’s step count data and compared it to that of a stranger. We saw participants recounting the moments of their weeks that contributed to the visualization, and sharing their stories with complete strangers.
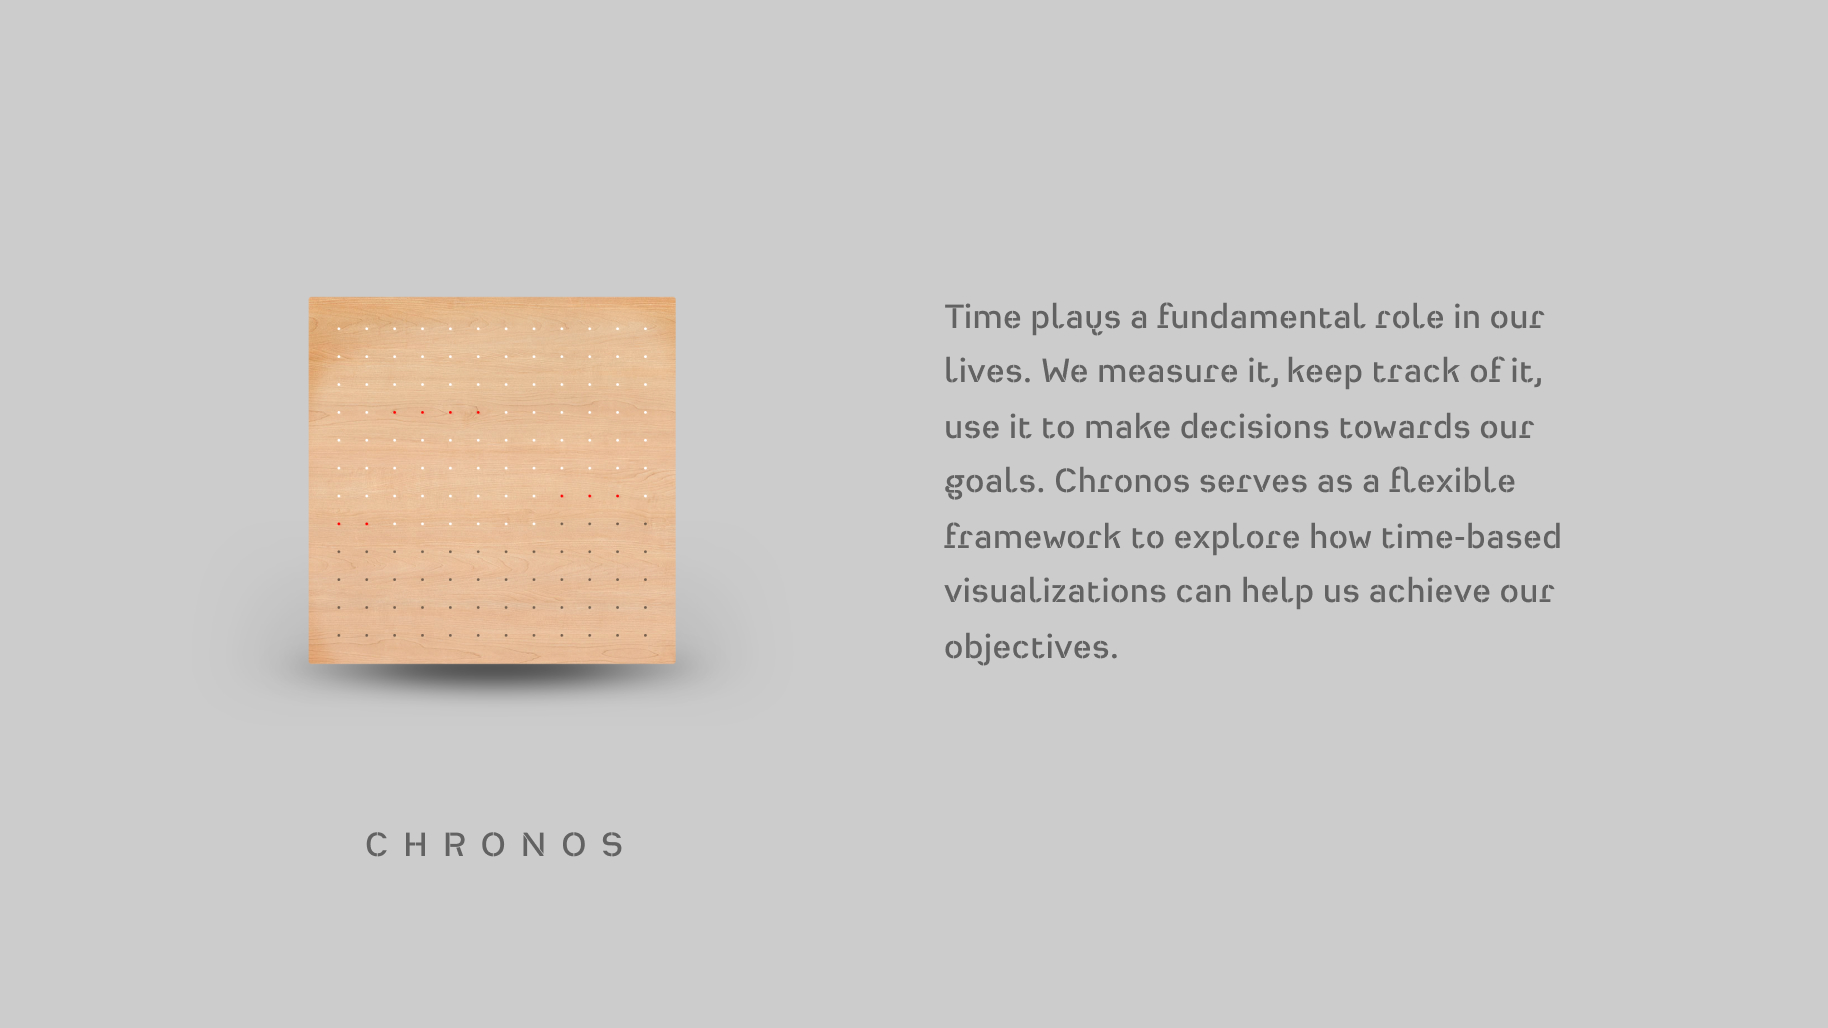
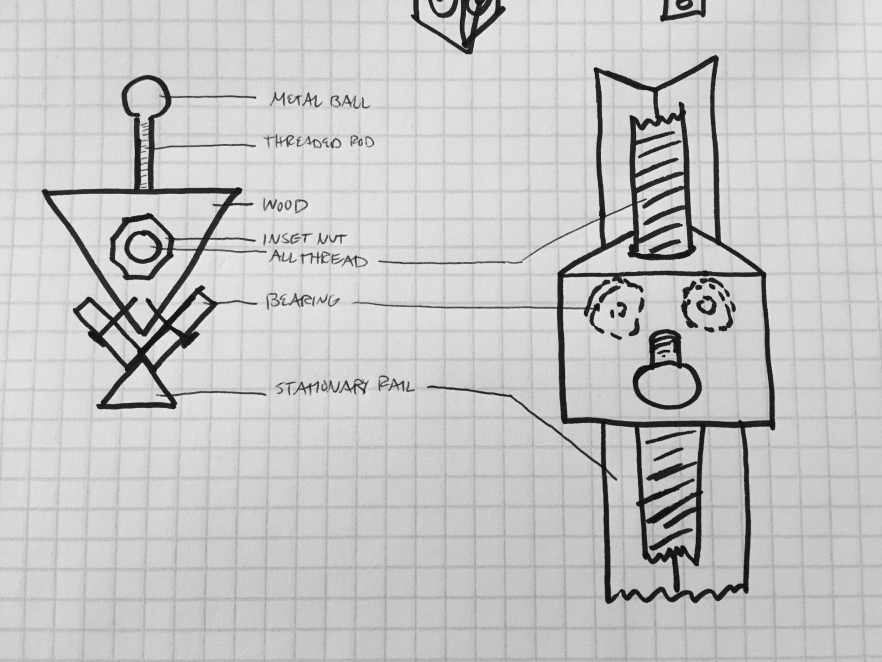
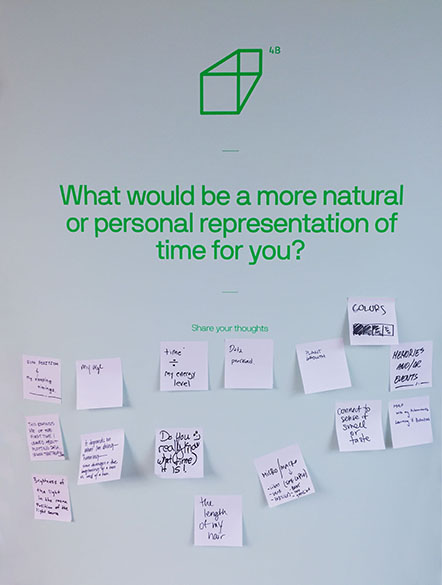
Artifact 2 – Chronos
Connecting time with behavior
We were curious how the system we use to understand time alters our interpretation of it, and how we might create a more natural and personal representation. We wanted to measure time with moments rather than minutes. Chronos uses color to show these daily moments, and by rolling it 90 degrees in any direction, we can re-sort time in a new way.
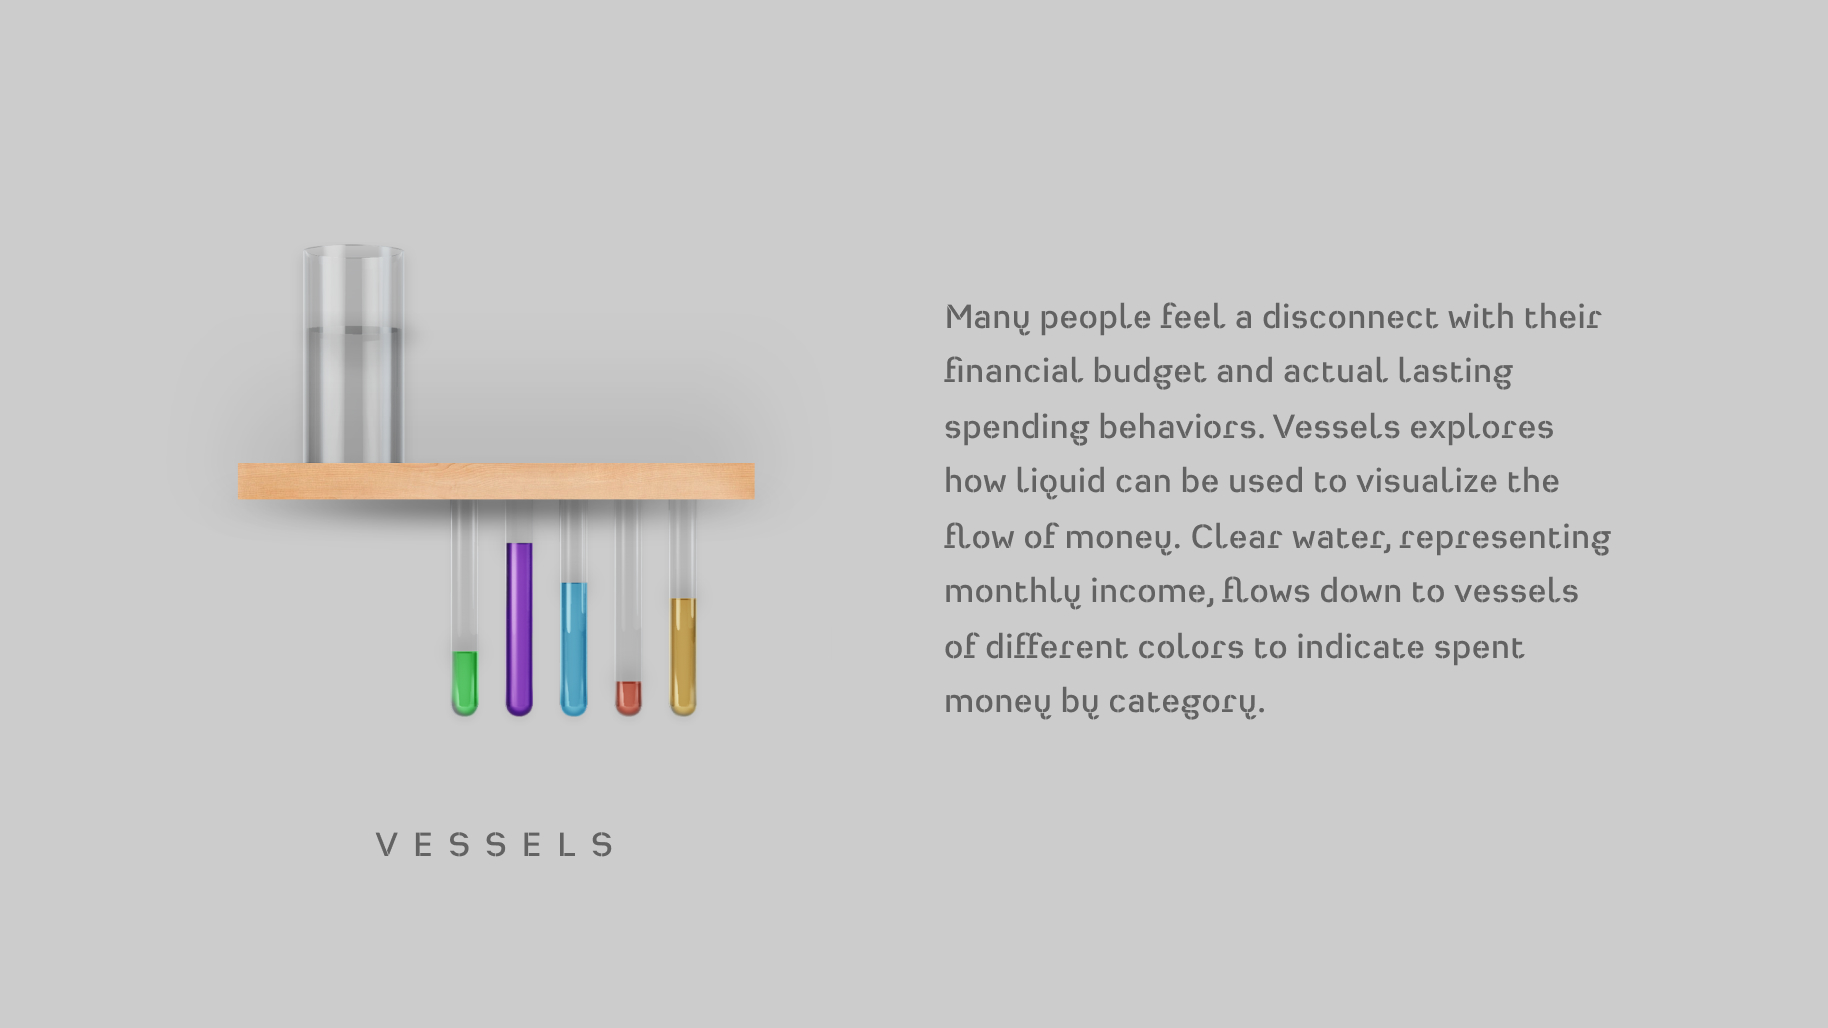
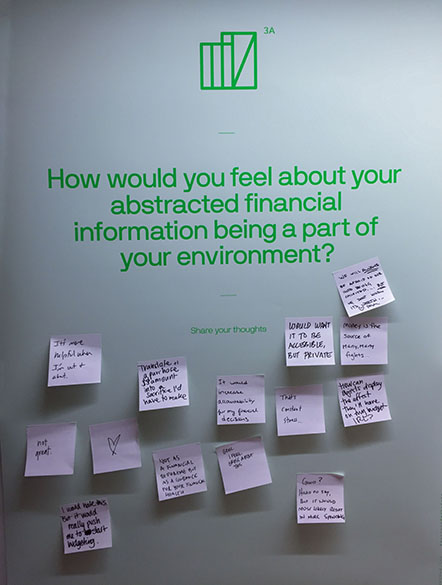
Artifact 3 – Vessels
Volumetric relationships to comprehend budgeting
Budgeting a limited resource over time can be hard for our brains to grasp. We wanted to explore how the analogy of moving of a physical material like water could help.
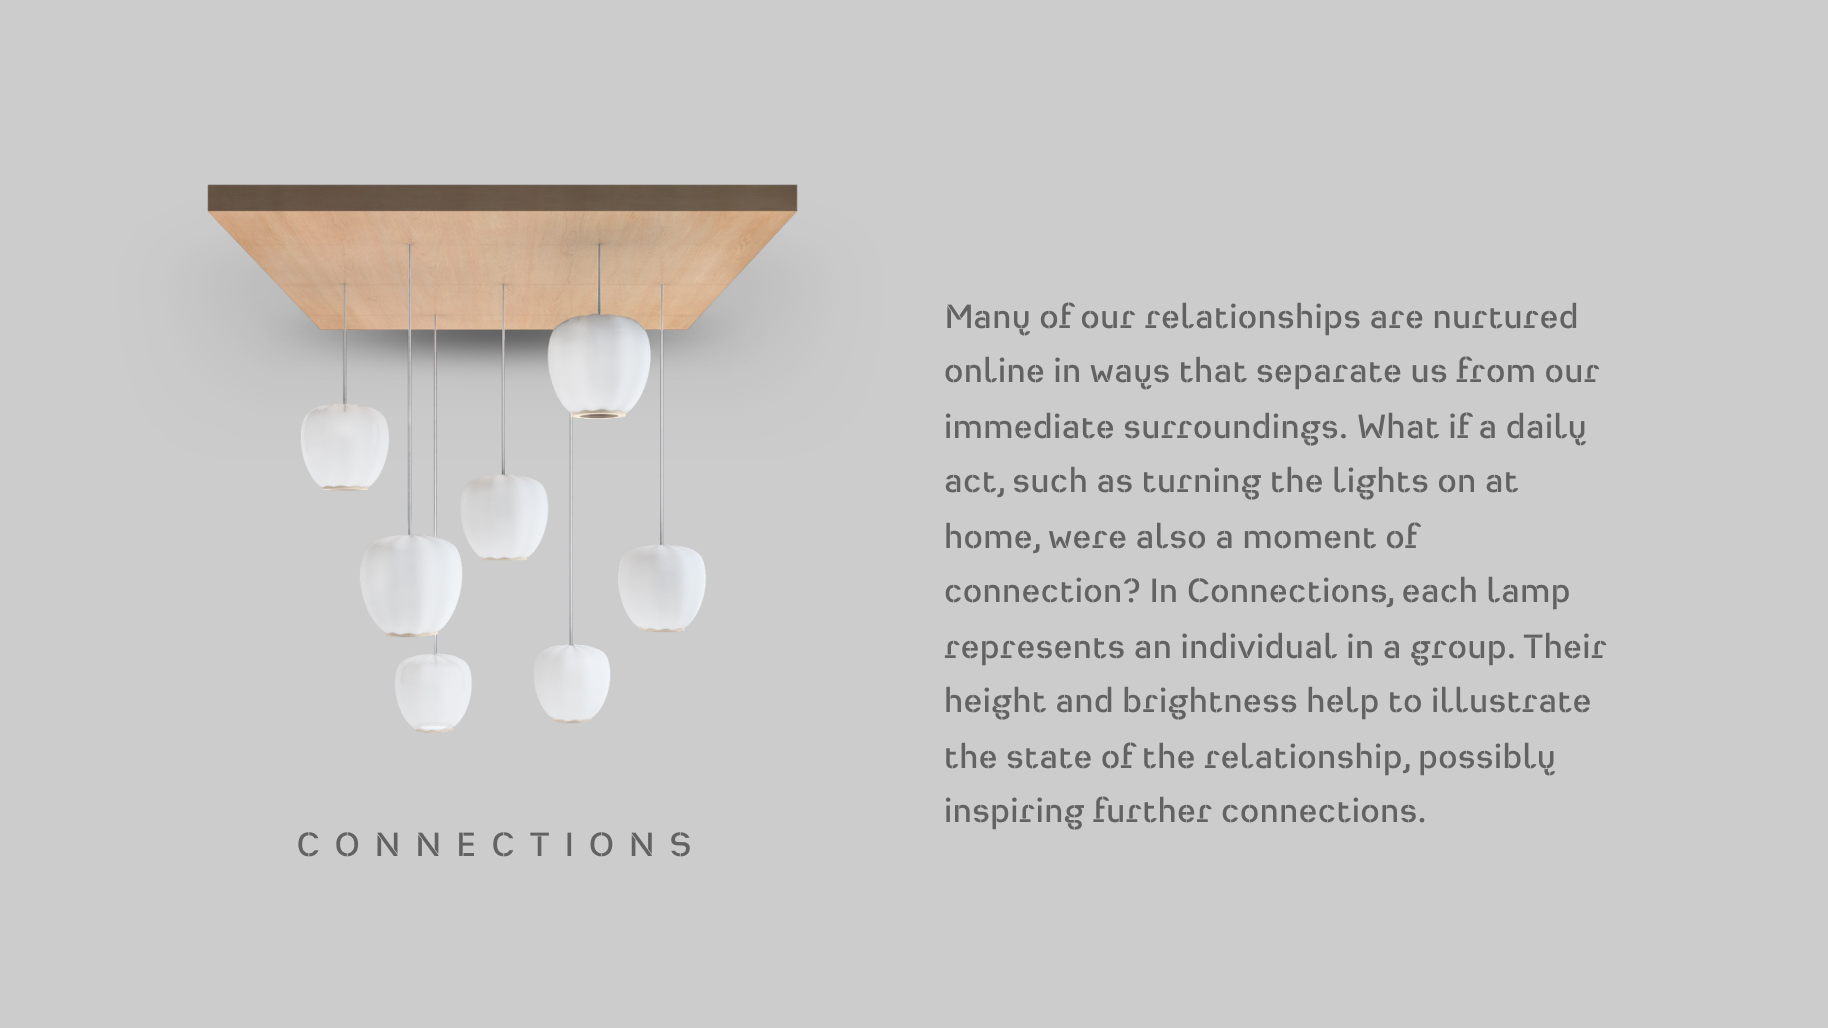
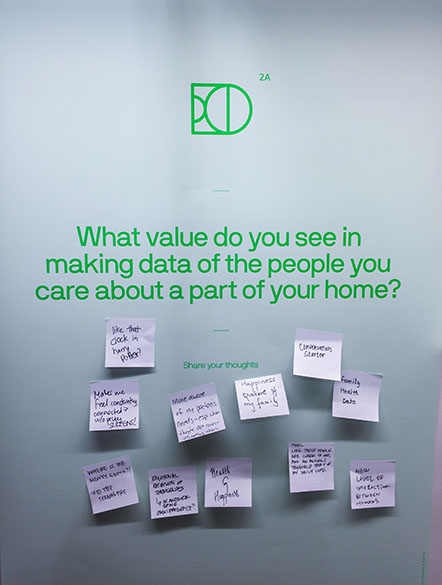
Artifact 4 – Connections
Illuminating our connections to others
We envisioned Connections being used across a close group of people with multiple installations synced. We were curious of the effects of having a data-driven object that you knew those close to you were experiencing in the same way.
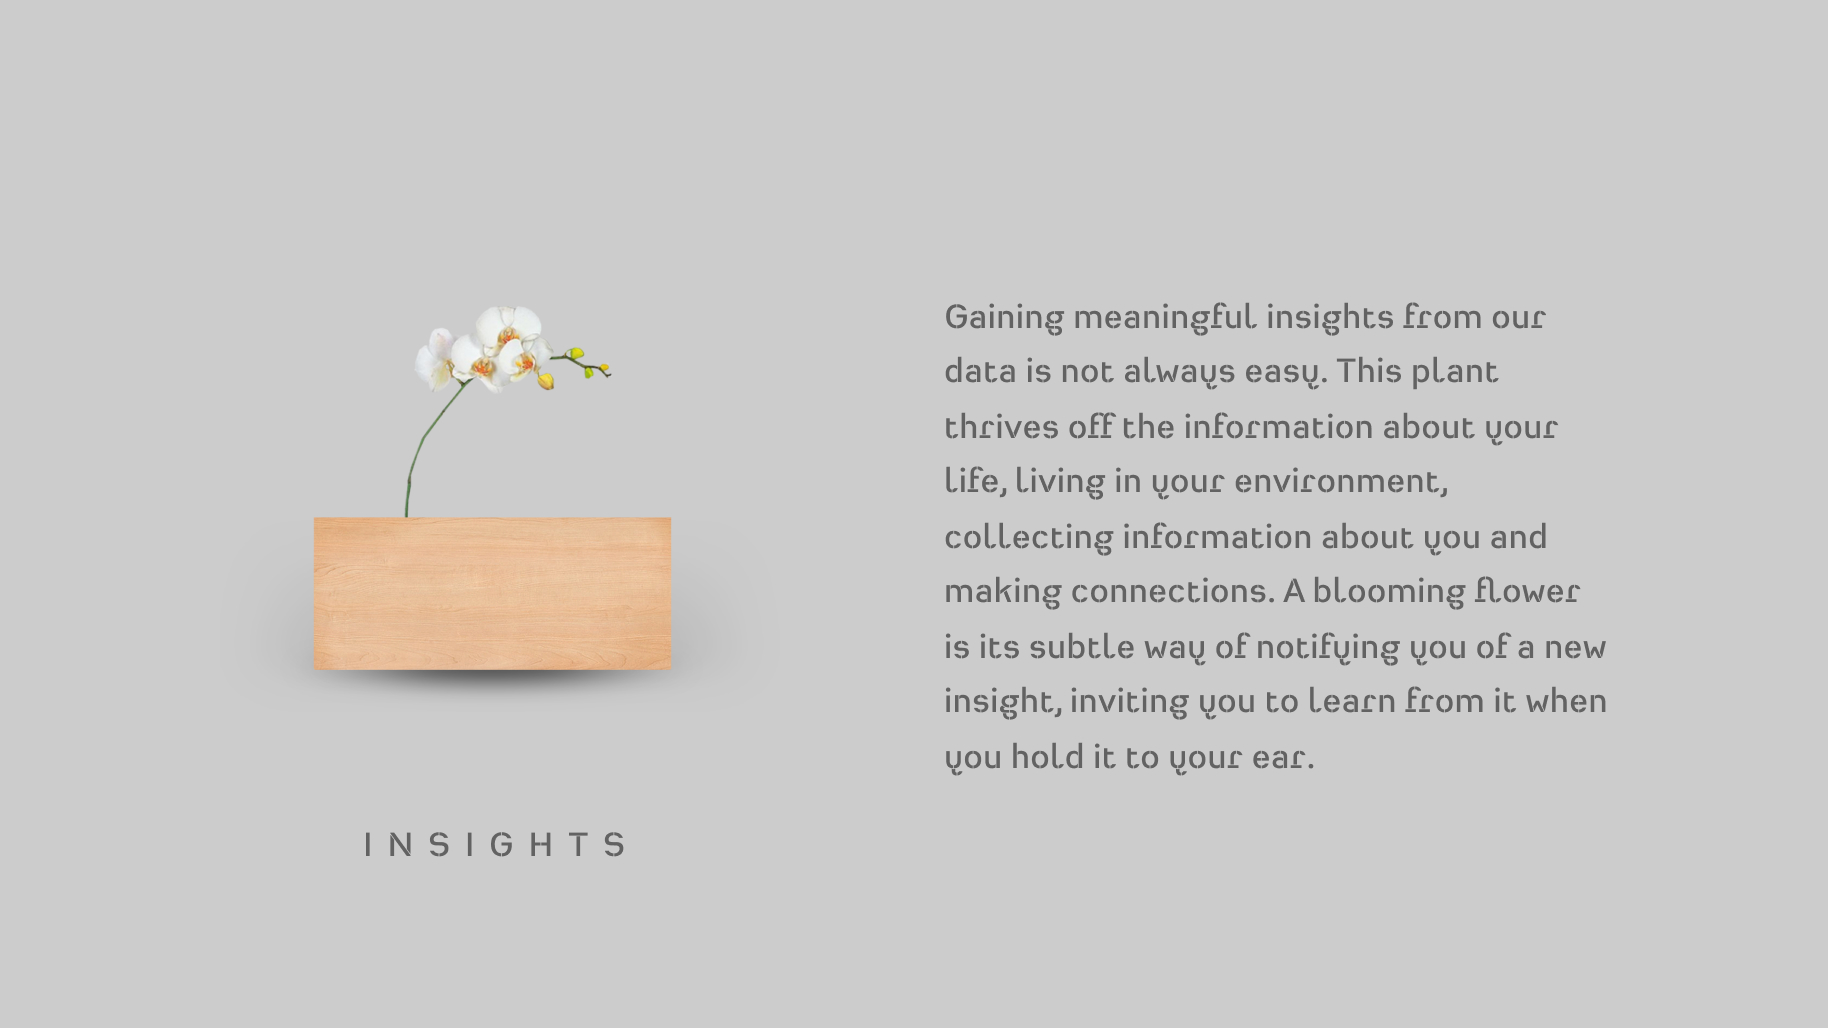
Artifact 5 – Insights
Artifact 5 – Insights
Data blossoms into insights
We wanted to explore how something as simple as a flower that changes in your environment might catch your attention, possibly helping you take a moment to reflect on an insight and even nurturing a new type of relationship with your data.
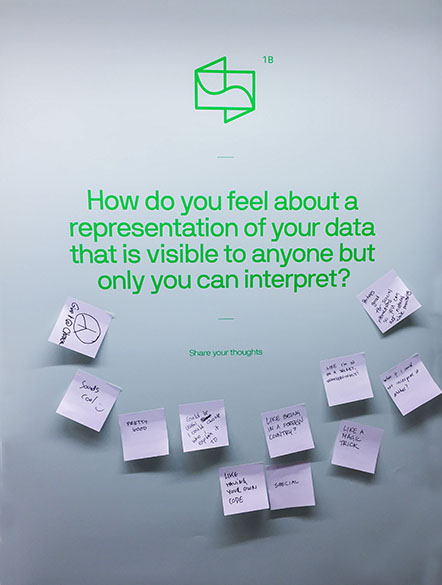
Approach
Enable privacy in plain sight
We imagined that the same artifacts might be able to tell a completely different story to each person that used it. By displaying no numbers or letters, these become public objects of beauty that tell rich stories to some that know how to interpret them, but render others illiterate. We were curious if this connection would lead people to continue their attention to the artifacts over time, rather than letting the data becoming noise.
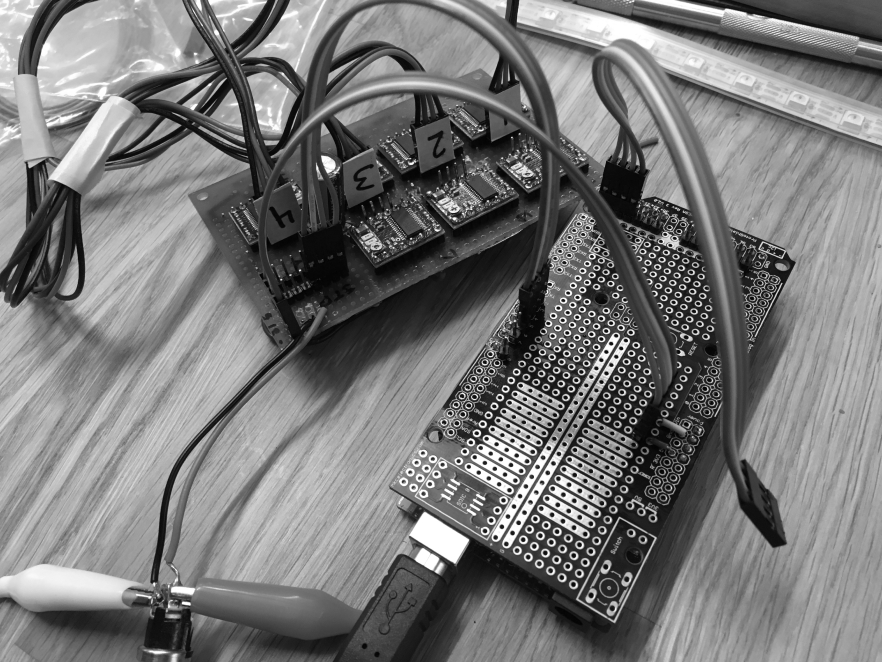
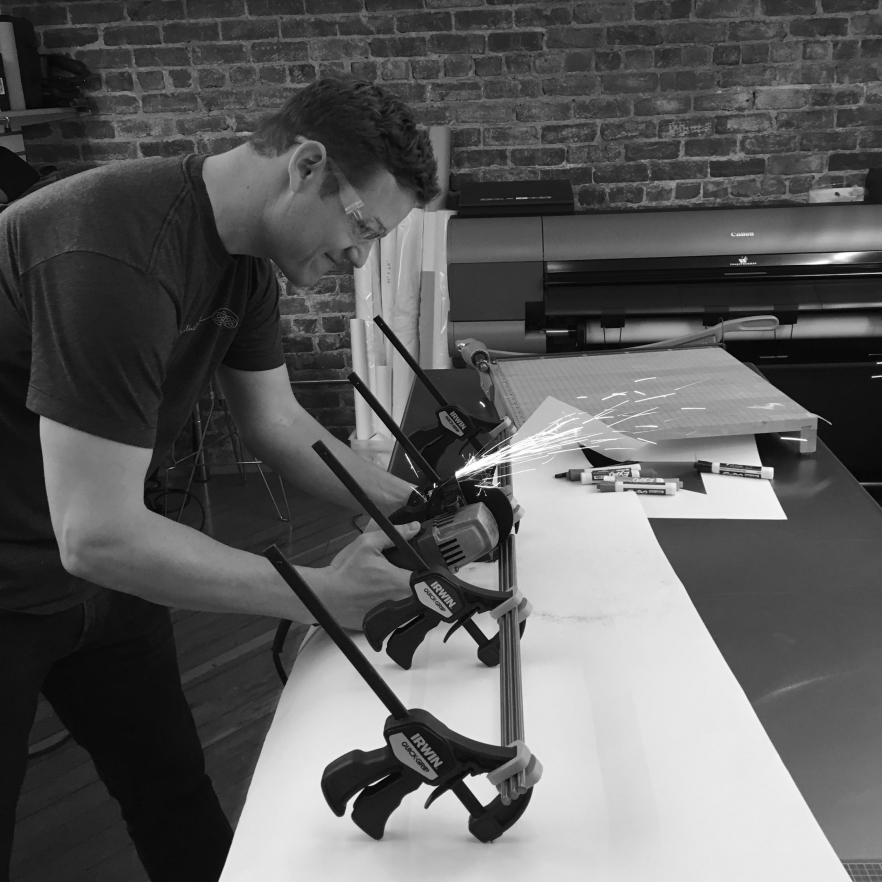
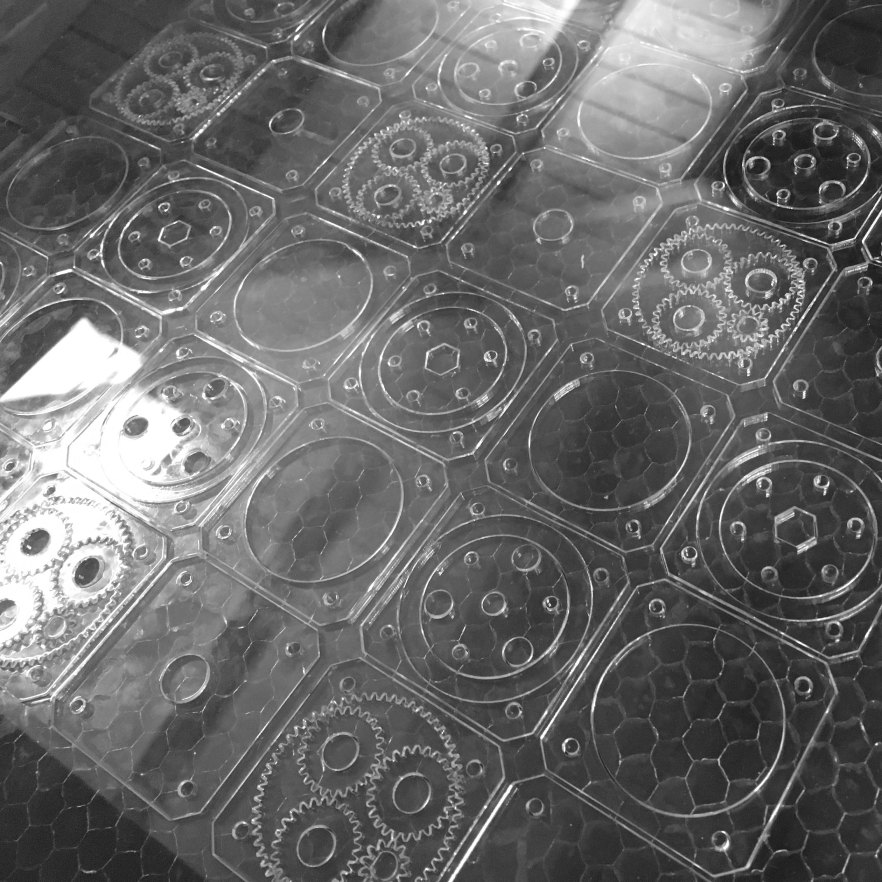
Process
Design and rapid prototyping of custom connected devices
In order to test our concepts against the hypothesis, we knew the artifacts had to deliver novel experiences in high fidelity using real data. We used a combination of IOT development, digital product design, robotics, and physical fabrication to bring the artifacts to life. Building unique mechanical objects with ambitious end experiences was extremely challenging and required a lot of trial and error.
You can read a detailed article on the design and construction on Medium.

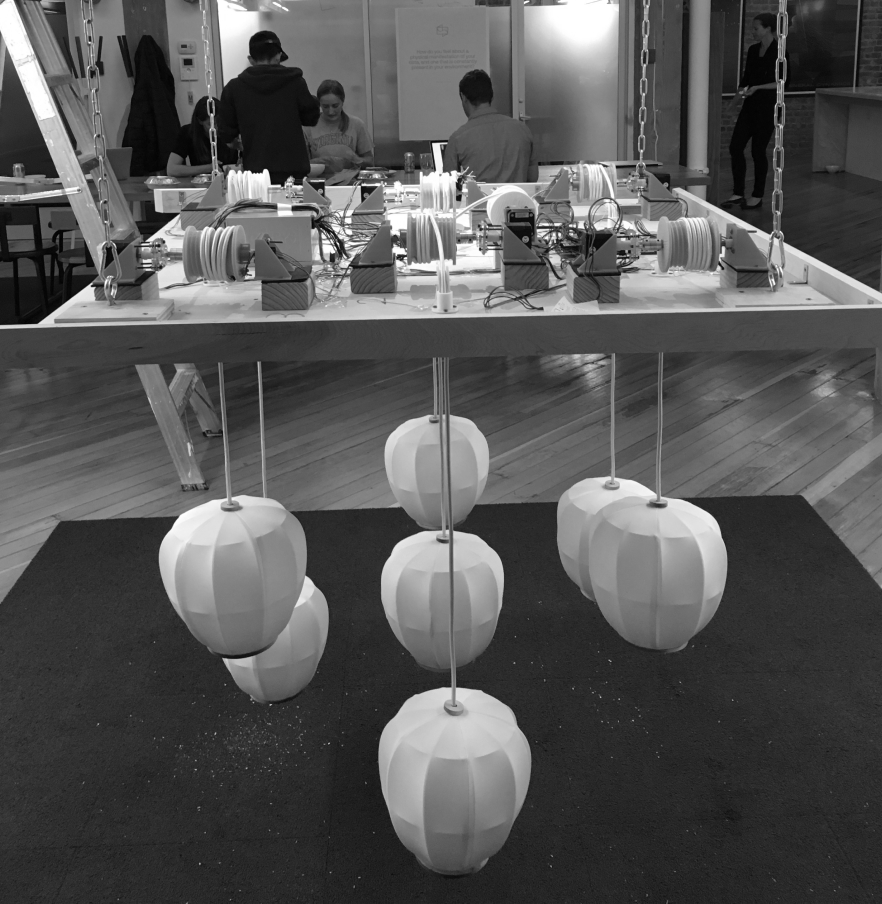
Showcase
An exhibition to collect insight and examine our hypotheses
We hosted an exhibition for SF Design Week to invite people to interact with artifacts and share their thoughts and experiences. We asked about the way they interact with their data collected about them, and listened to ideas the artifacts inspired in them. This exhibition helped celebrate the inherent unfinished nature of these 5 artifacts, and helped continue their story. These were not functional things born by designers to become products, but seeds meant to be morphed and molded by the meaning offered by their users.
Read more about the findings from the SF Design Week exhibition
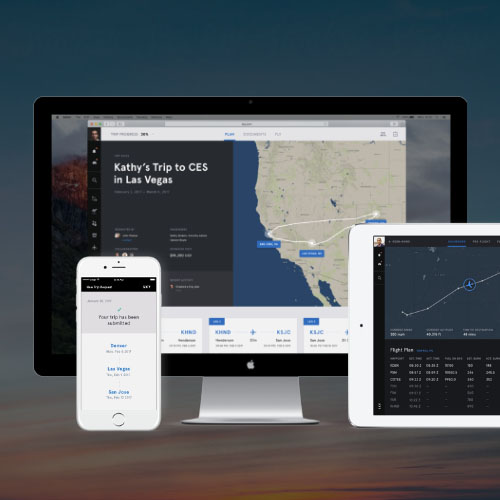
Aviation ClientProduct and Service Ecosystem
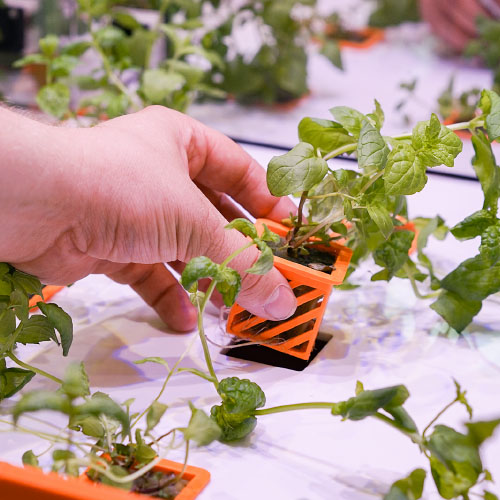
Connected FoodHardware Prototyping & Speculative Design
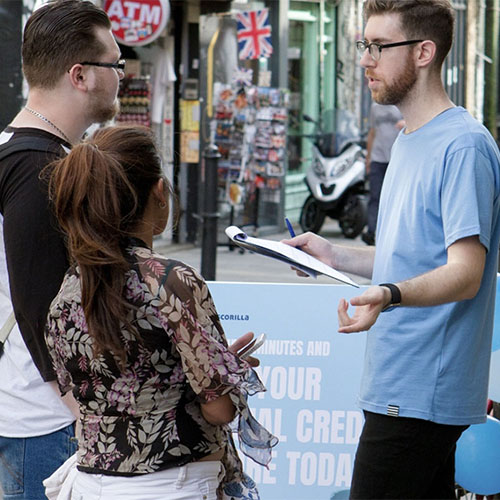
Future of FinanceStrategic Design
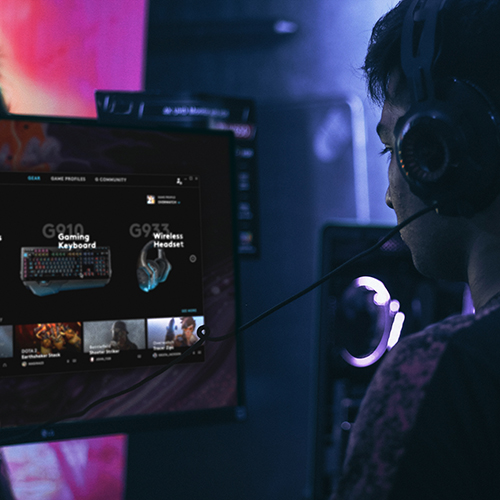
Logitech G HubProduct Design & User Validation
ScoutImmersive and Personalized Education
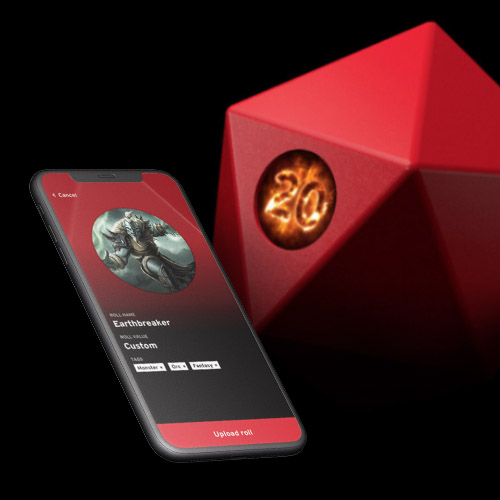
BIG20Physical Product Launch
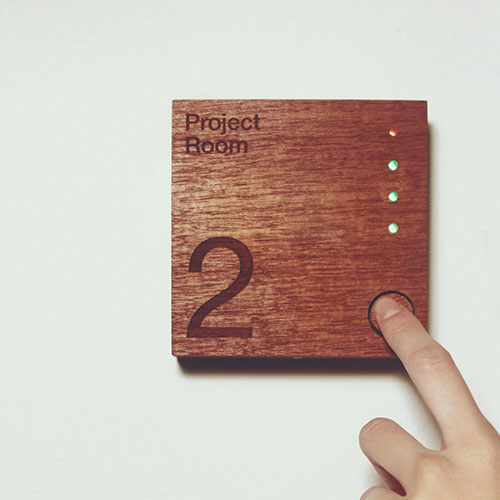
RoomieIoT Connected Room Sign